If you are like me, you probably keep track of the latest reviews for upcoming smartphones and tablets, wondering which device to buy next.
Part of the review process for many new devices includes a section called benchmarks. This usually is the part that turns the comments box of many websites into a passionate debate on which processor is better and also how to benchmark graphics cards properly and which are the best GPU benchmarks to use.
In this article, I will be giving my take on measuring GPU performance, since it is perhaps one of the most disputed topics in mobile chips.
Note: You are reading an article that is over five years old. Find out more about our latest of graphics IP, the IMG B-Series, and read this blog post discussing the need for better benchmarks for newer technology such as ray tracing.
What Are Graphics Benchmarks?
There are many graphics benchmarks to choose from but today I will be focusing on the three below:
- 3DMark Ice Storm from Futuremark
- GFXBench 3.0 from Kishonti
- Basemark X from Rightware
All of the above include game-like graphics tests that contain highly complex content which aims to push the GPU to the limit. The results offer consumers an idea of the relative performance of current devices but also to provide semiconductor companies and OEMs a way to analyze their next-generation designs.
We use these benchmarks too – and many others – to offer you performance efficiency numbers for our PowerVR graphics IP. For example, when we introduced our PowerVR Series6XT family, we stated the following:
[PowerVR] Series6XT GPUs achieve up to a 50% performance increase on the latest industry standard benchmarks compared to equivalent configurations of previous generation GPUs. And with a significant increase in raw GFLOPS, Series6XT delivers the industry’s best performance in both GFLOPS/mm2 and GFLOPS/mW.
These figures were based on multiple and extensive runs of the tests above which feature impressive visuals and detailed rendering. We continue to use these benchmarks – in addition to real world applications and feedback from developers or customers – to optimize the driver performance for our latest PowerVR Rogue GPUs.
Frames per second
Open up any of the results page for the most popular graphics benchmarks today and you immediately see a few headline numbers.
Probably the common number across every benchmark is the frame rate, expressed in frames per second (fps). This is an objective score based on the total frame time required to complete a given workload.
For example, the Manhattan test (part of the GFXBench 3.0 suite) lasts for 62 seconds and includes a sequence that implements the latest OpenGL ES 3.0 features. Let’s examine the latest Teclast P98 Air results; the tablet has an Allwinner A80T processor that features a PowerVR G6230 GPU. The offscreen performance of this particular chip is 7.0 fps; this means that the GPU is able to render 432 frames in 62 seconds.
The fps information can be presented to end-users in a variety of ways. Since a well-designed GPU benchmark workload is very heavy and tends to result in low fps figures for entry-level devices, some consumers might assume the low result implies a low performing GPUs.
To battle this misconception, Rightware’s Basemark X uses a method of normalization and multiplying to derive a score with a higher nominal value. If we look at the Power Board offered by Rightware, the PowerVR SGX544MP2 GPU inside the Asus Memo Pad FHD 10 tablet achieves an average score of 9961.47.
The result above is obtained by Rightware by using the following formula:
Final score = 2500 * FPS(DUNES_OFFSCREEN)/REF_DUNES + 2500 * FPS(HANGAR_OFFSCREEN)/REF_HANGAR
REF_DUNES and REF_HANGAR are off-screen fps numbers achieved on a Samsung Galaxy S4 (GT-I9505). The actual values for these reference numbers are:
- REF_DUNES = 7.6897 fps
- REF_HANGAR = 5.6559 fps
Choosing a reference metric based on the concept that generally higher is better makes things easier for consumers. But the overall score is actually a combination of multiple elements and typically hides the underlying details; therefore, it is important that benchmark users always look beyond the simple score when making in-depth technical analysis and request to see all the facts.
It is also useful to remember that most benchmarks are designed to stress the design to the maximum; therefore, a low fps number does not automatically mean a bad user experience since most real-world applications are highly optimized to run well across many devices, including affordable platforms which may have a more modest GPU on board.
Triangles
Triangles are perhaps the most abused and overrated metric in graphics today – and I cannot stress this enough. Real world applications have modest triangles rate requirements; moreover, high triangle rates in mobile quickly become memory bandwidth limited way before they turn out to be GPU-limited.
In fact, on most GPUs today, triangle throughput is no longer a problem – or even a relevant metric. Mobile GPUs today can easily support 100 to 200 million triangles per second (MTri/s), providing more than enough resources for real world cases. Additionally, this number even exceeds excessive usage cases such as one triangle per pixel at 60 fps for Full HD (1080p) resolutions.
If we look at mobile games today, racing simulators or first person shooters featuring intensive 3D graphics usually average tens of thousands of triangles (e.g. Real Racing 3 has 80,500 while Shadowgun: Deadzone pushes around 20,000) while casual-style 2D games usually stay in the thousands range (e.g. The Simpsons Arcade peaks at below 10,000).
Even the graphics tests in the Ice Storm suite from 3DMark only go up to 190,000 triangles; we have also shown the Cloud Gate graphics test (1.1 million triangles) running smoothly on current-generation PowerVR Rogue GPUs at MWC this year. The scene below contains OpenGL ES 3.0-based particle effects, FFT-based bloom and depth of field effects.
 Imagination was first to demonstrate 3DMark Cloud Gate (1.1 million triangles, 15.6 MPixels) running on PowerVR Series6 GPUs
PowerVR Rogue GPUs deliver several hundred million triangles per second, which is more than enough to run even the most geometry-intensive real world applications.
Pixels and texels
Pixel rates on the other hand are probably the most important metric for all market segments and typical usage scenarios. User interfaces or browser running at 60 fps are all about pushing textured pixels.
If you are looking for an easy top level requirement calculation, the formula below offers you the headline million pixels per second (MPix/s) figure:
Screen resolution x fps = pixels/sec
Often enough, this number has to be multiplied with the complexity factor of a scene since texture and alpha layers can add quite a significant level of complexity. The table below offers you an indication of how pixel performance stacks up for a range of popular devices:
![]() Pixels per second is probably the most important metric for all market segments and typical usage scenarios
Pixels per second is probably the most important metric for all market segments and typical usage scenarios
If you are using GFXBench, a metric that indicates texel (texture pixels) performance is Fill. For example, the PowerVR G6400 GPU inside the Intel® Atom™ Z3460 processor offers 3225 MTexels/s.
In the case of 3DMark Ice Storm and Ice Storm Extreme, the pixel load varies between 1.9 to 18.6 million. Futuremark has published the details of each test and the score formulas in a publicly-available technical guide; the company is among the few mobile benchmark developers that openly share the inner workings of benchmarks in this way.
Note: when you look up pixel or texel rates for GPUs, make sure the vendor is quoting sustained and real measured fillrate, not just theoretical peak numbers.
GFLOPS
Floating point operations per second (FLOPS) are increasingly becoming a critical parameter for mobile GPUs when it comes to graphics and compute performance. The FLOPS metric indicates the number crunching ability of a graphics processor and can be compared to the million instructions per second (MIPS) that a CPU can deliver.
FLOPS determine ALU shader complexity level and usually impact several elements related to rendering a scene: the complexity of animation and lighting, the complexity of pixel shading, image quality and user experience.
The increase in FLOPS performance has been exponential, following the same trend seen in desktop PC and console markets. The diagram below gives you an indication of how PowerVR GPUs have evolved over the last decade:
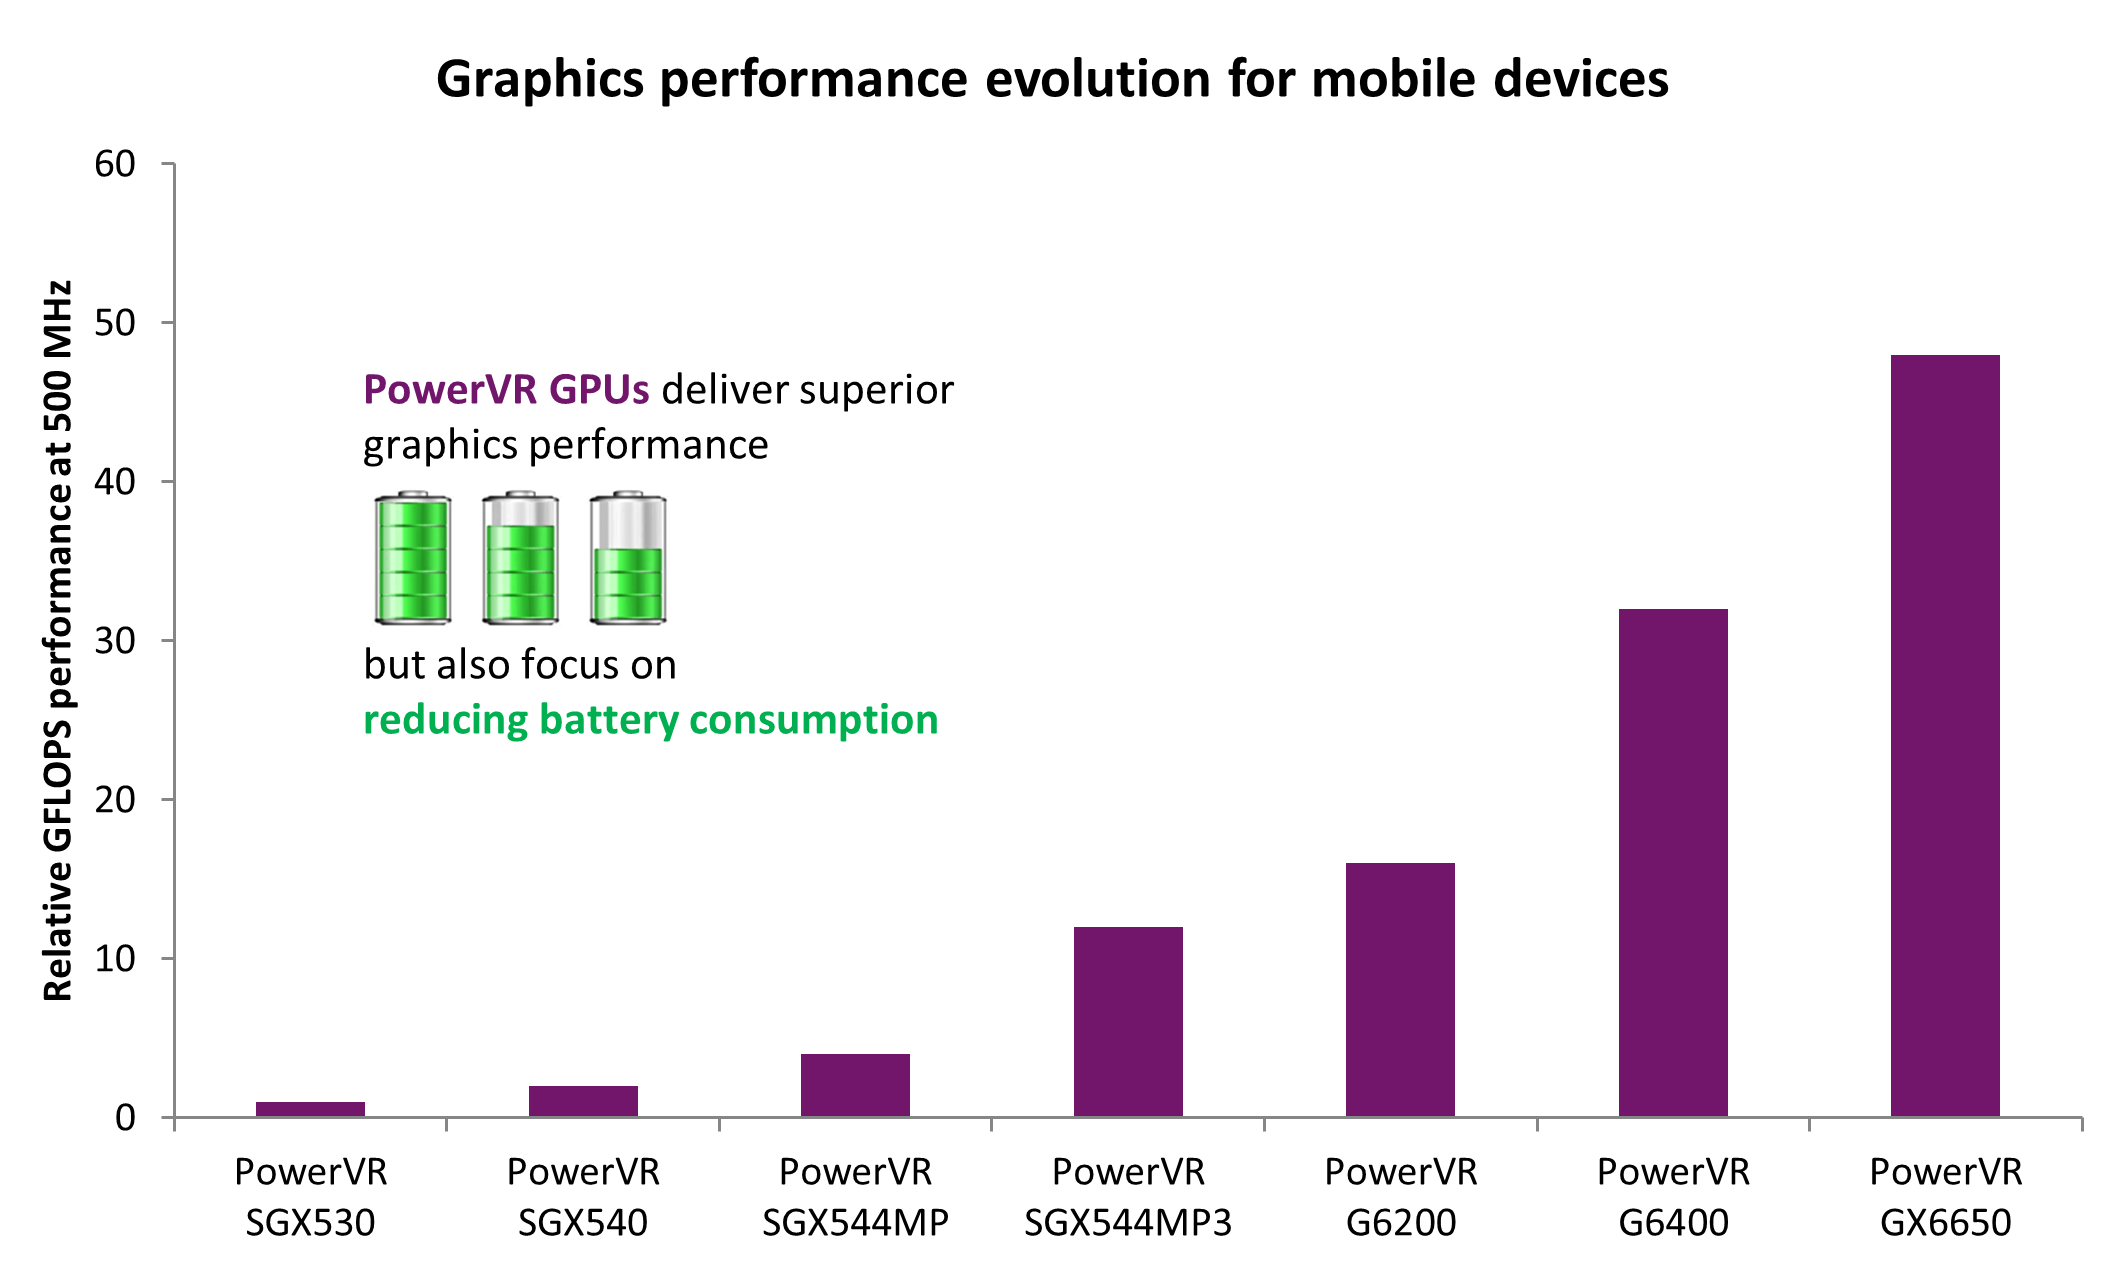 Mobile GFLOPS performance has seen exponential growth
GFXBench 3.0 includes a test called ALU which is designed to measure ALU performance for a given scenario and uses a relatively complex pixel shader.
However this should not be used to determine peak GFLOPS performance since that would require a highly optimized micro-benchmark. Mobile GPUs can have very different architectures so ALU tests that determine peak GFLOPS performance must be carefully designed and optimized down to the metal.
Driver overhead, physics and other various tests
Some graphics benchmarks also include tests that focus on other areas related to rendering. For example, GFXBench 3.0 offers a Driver overhead test which is essentially a test that measures the impact of making a range of real world API calls through the driver (e.g. switching states).
There are also a few tests inside graphics benchmarks that are related to other parts of the chip. For example, the physics test in 3DMark mostly measures CPU performance.
Long-term performance
If you are looking at a better indication of real-world workloads for current-generation graphics hardware, long term performance is probably your best bet.
No benchmark should exclude this important feature. What really matters in real world applications is delivering sustained performance over time (i.e. tens of minutes) – not just the first minute; if you look at some recent results in GFBench 3.0, you can see how competing products aggressively throttle over time, dropping to 30% to 50% of peak performance. Meanwhile, PowerVR GPUs do not skip a single beat.
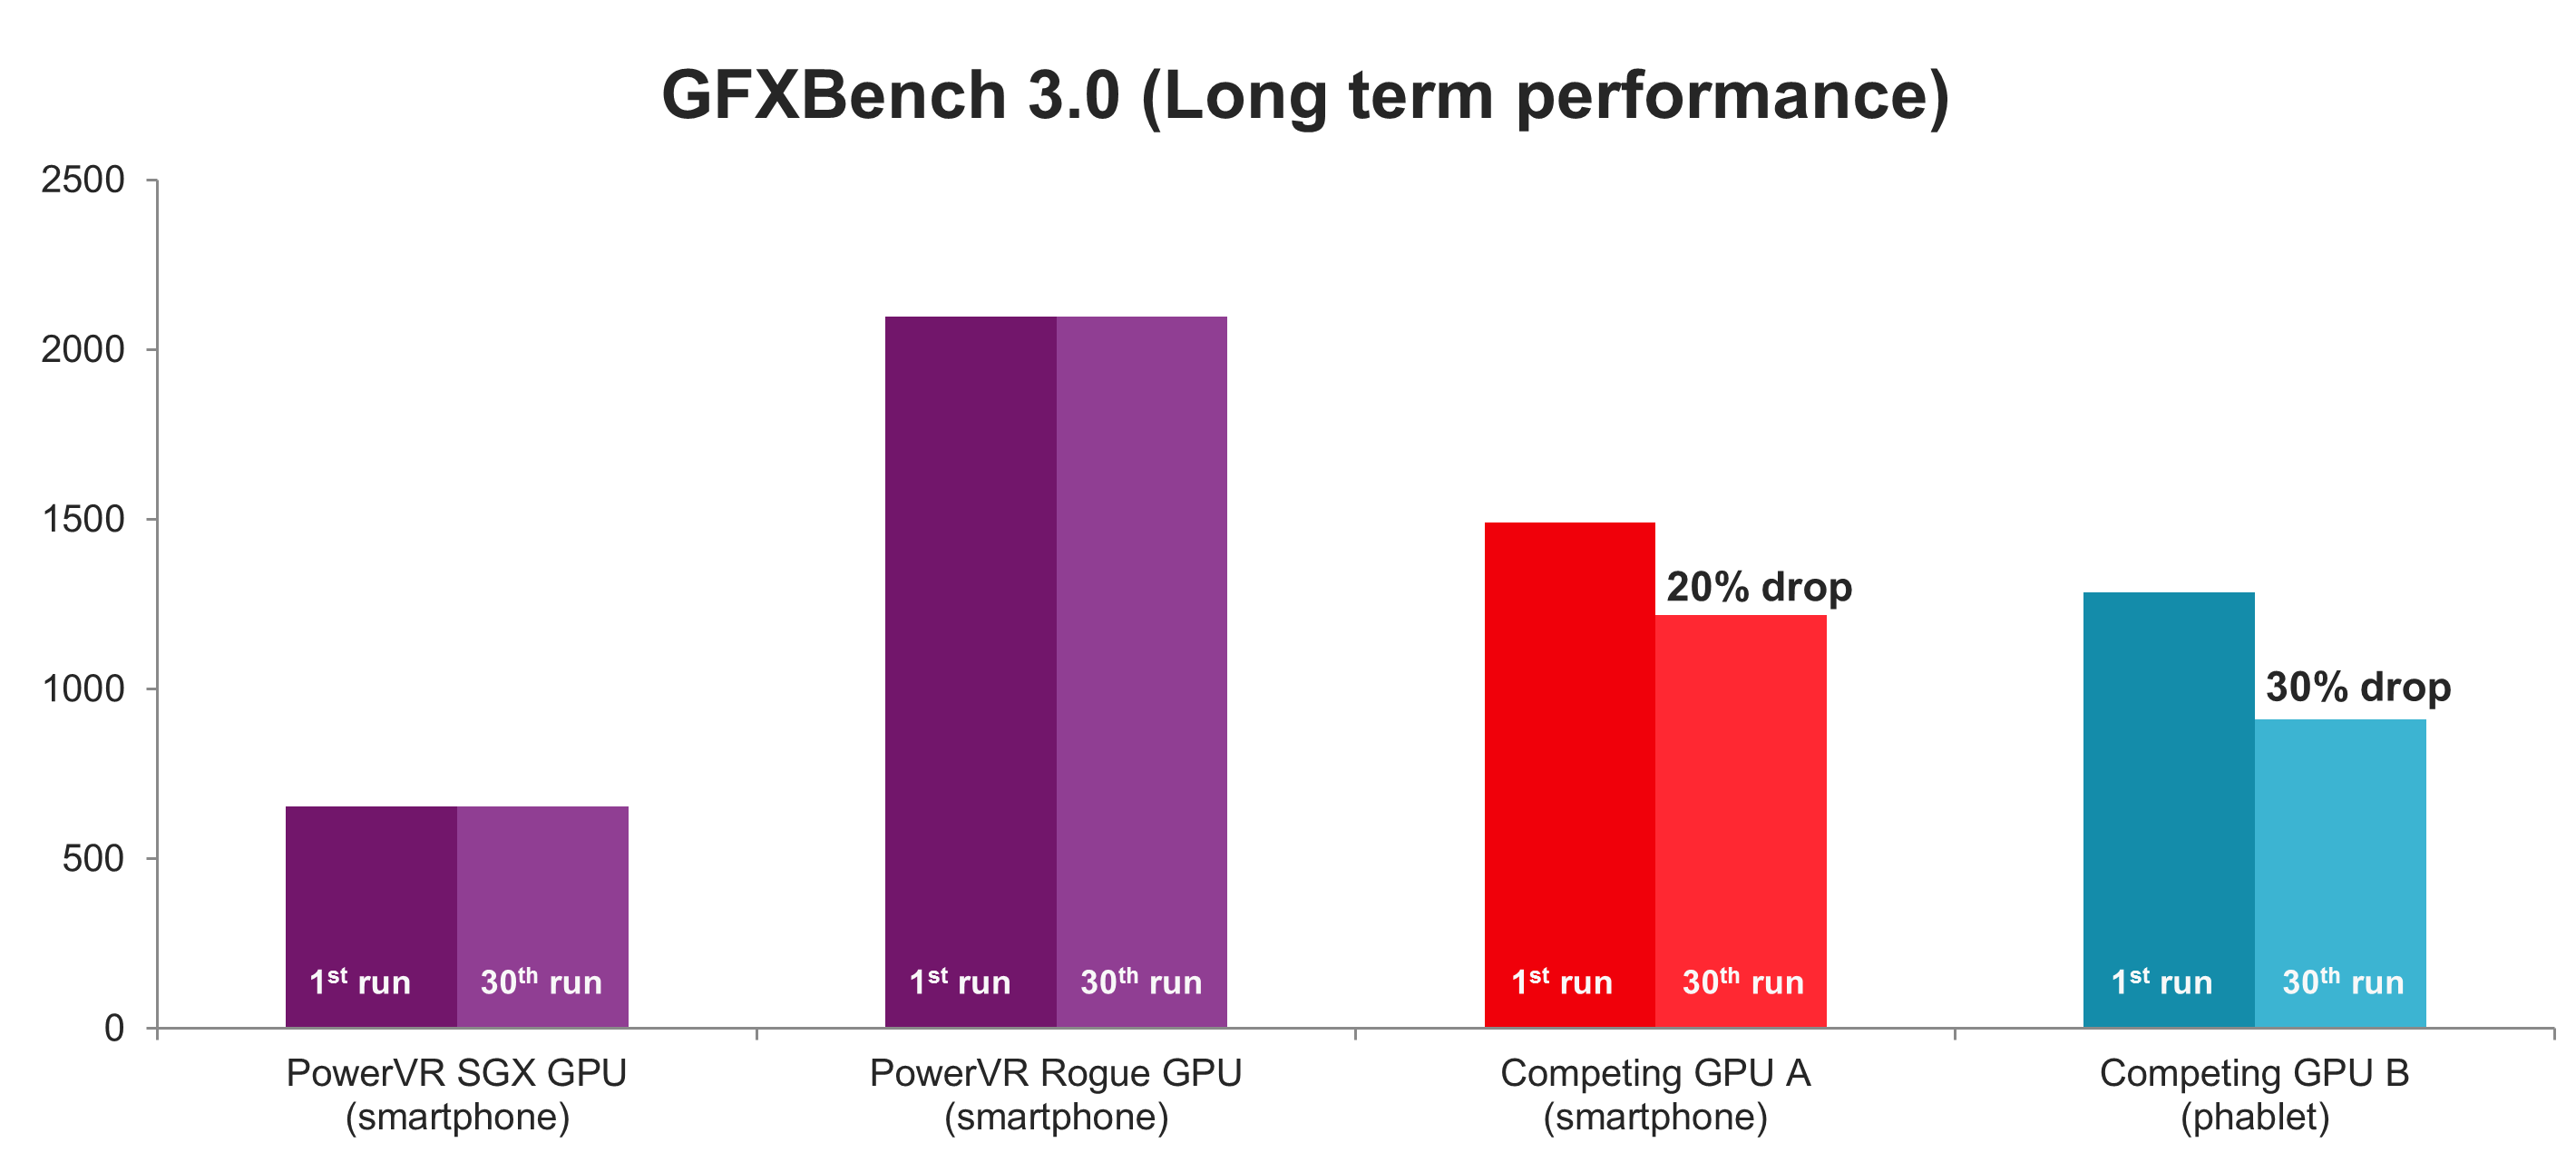 PowerVR GPUs deliver sustained performance
Final words
GPU metrics sound simple, but the complexity of the underlying architecture and the fuzziness of terms like vertex, triangle, shader and cores often lead to abuse or confusion.
So what are benchmarks useful for, you might ask? For one, usually graphics IP does not exist in silicon at the time of licensing, so we use benchmark results to give an indication of performance to our customers. Imagination has extensive emulation capabilities and quotes all frames used in testing.
Secondly, benchmarks offer useful single data points that show performance for a specific usage; the results needs to be well understood and carefully used since a given benchmark might bear no relation to a specific product.
Let’s say you are benchmarking a smartwatch or an embedded platform. There is no point comparing it to a high-end smartphone; they have completely different specifications, use cases and performance requirements. This is where benchmark results are usually abused and become inadequate, irrelevant or even a distraction.
I hope this article has offered some perspective on evaluating GPU performance. Stay tuned to the blog for another article that attempts to evaluate the state of affairs in CPU benchmarks.
You can find out more about our latest of graphics IP, the IMG B-Series, and read this blog post discussing the need for better benchmarks for newer technology such as ray tracing.