This is the first in a short series of posts about our recent collaboration with Chukong Technologies on the Cocos2d-x game engine. In this article, I will offer you a short overview of our analysis and optimisation process for Cocos2d-x based graphics demo called Fantasy Warrior 3D.
What is Cocos2d-x?
Cocos2d-x is a suite of open-source, cross-platform game development tools, written in C++. The engine is the world’s most popular open-source game engine and, according to the latest AppBrain data, it is the second most popular game engine on Google Play after Unity.
Cocos2d-x games are popular for a few key reasons, namely for the engine’s ease of development, open-source customisation, compatibility and, most importantly, the overall quality of the games it produces.
While the Cocos engine is very popular in the Linux and Android communities, developers can easily port and run their games on other platforms such as iOS or Mac.
The Cocos2d game engine has traditionally been 2D only; however, over the last few years, Chukong have diversified the engine and added 3D rendering to complement its popular 2D toolset. This now means Cocos2d-x 3D games are a feasible option.
Cocos 2D Game Development: Fantasy Warrior 3D
Fantasy Warrior 3D is a showcase project using Cocos2d-x 3.4. It is an import demo that covers several 3D core features in Cocos2d-x:
- sprite3D
- animation3D
- mesh
- billboard
- camera
- light
- new audio engine
As a stand-out example of Cocos2d-x game development, the demo’s main purpose is to show developers how to create a 3D game using Cocos2d-x and it is an ideal starting place for optimizing a graphics application created using Cocos2d-x with our PowerVR SDK toolset.

The code is hosted on GitHub and distributed under the MIT licence.
PowerVR GPU architecture overview
First of all, let us go through an overview of PowerVR TBDR Architecture.
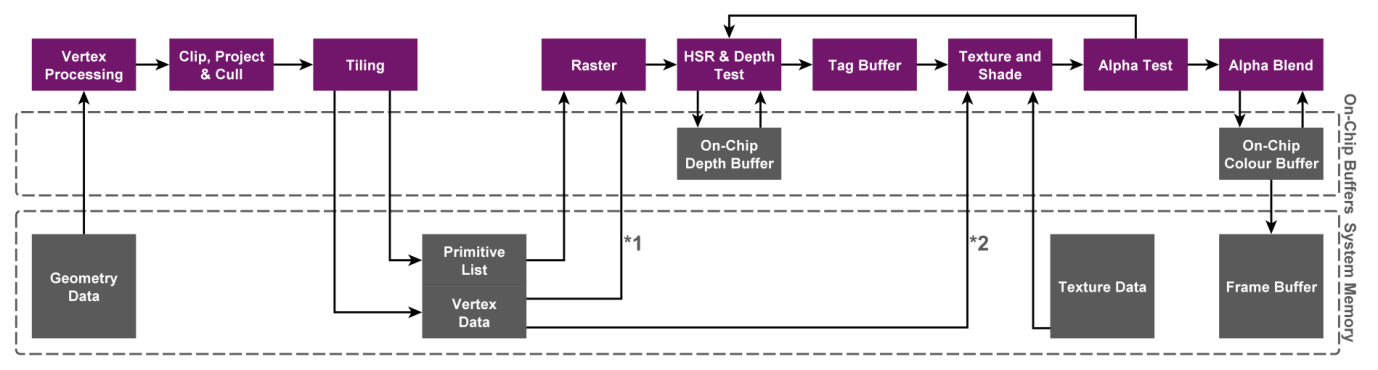
The architecture has two key features: Tiling and deferred rendering.
Tiling is a process used to increase the efficiency of rendering images on a display. It splits up the geometry data into small rectangular regions that will be displayed as one image, which we call tiles.
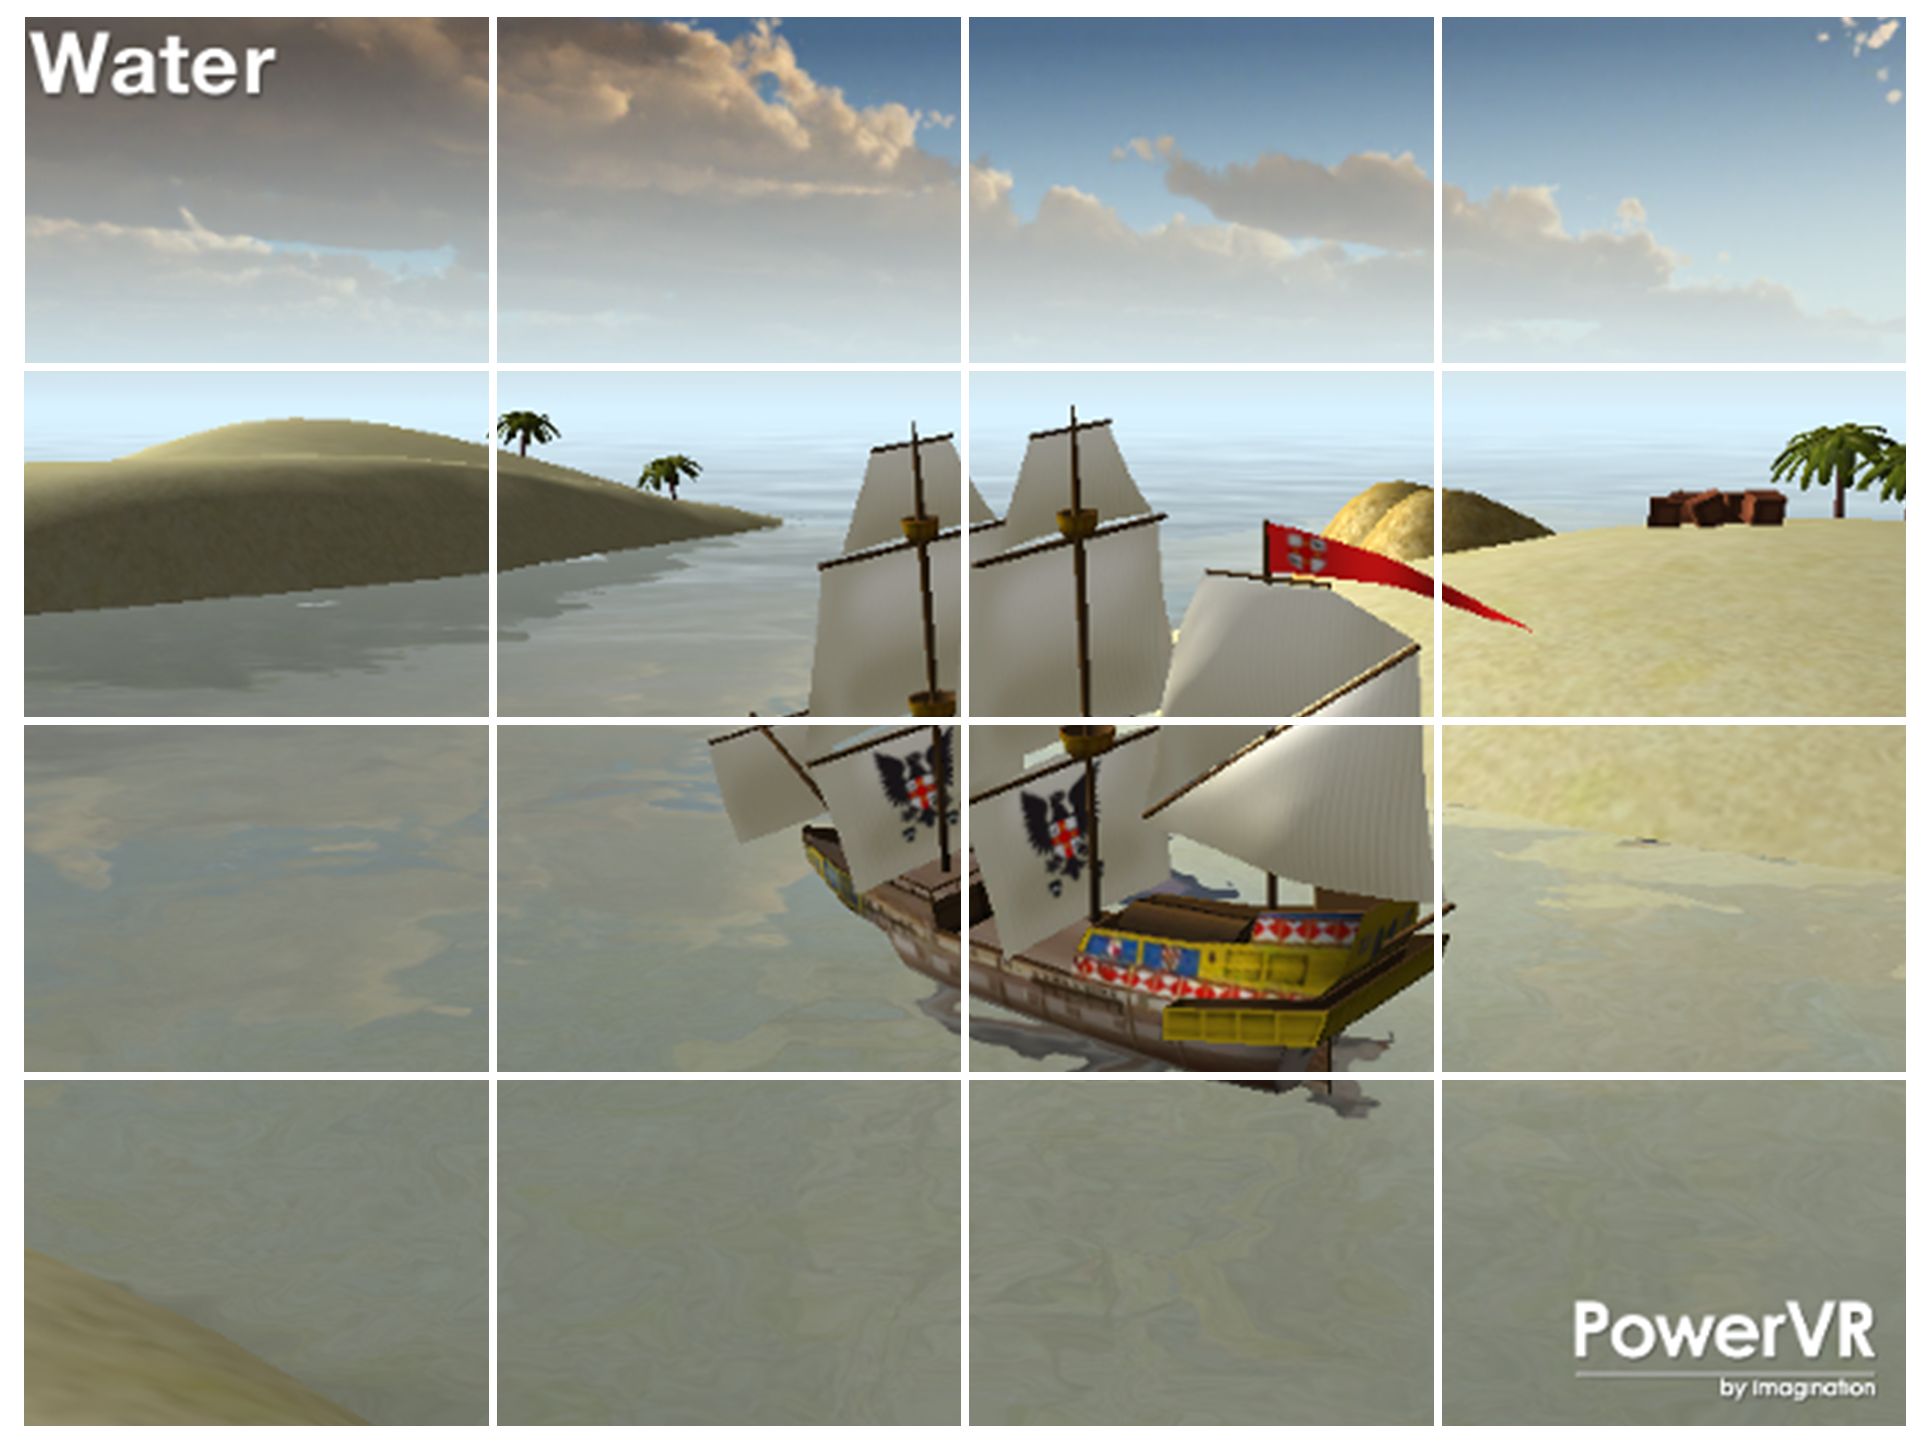
Each tile is rasterised and processed separately, requiring less processing power long-term as the GPU can use on-chip buffers for colour, depth and stencil buffer read-modify-write operations instead of wasting bandwidth sending data to/from system memory.
For the deferred part, there is a process called Hidden Surface Removal (HSR) which completely removes overdraw.
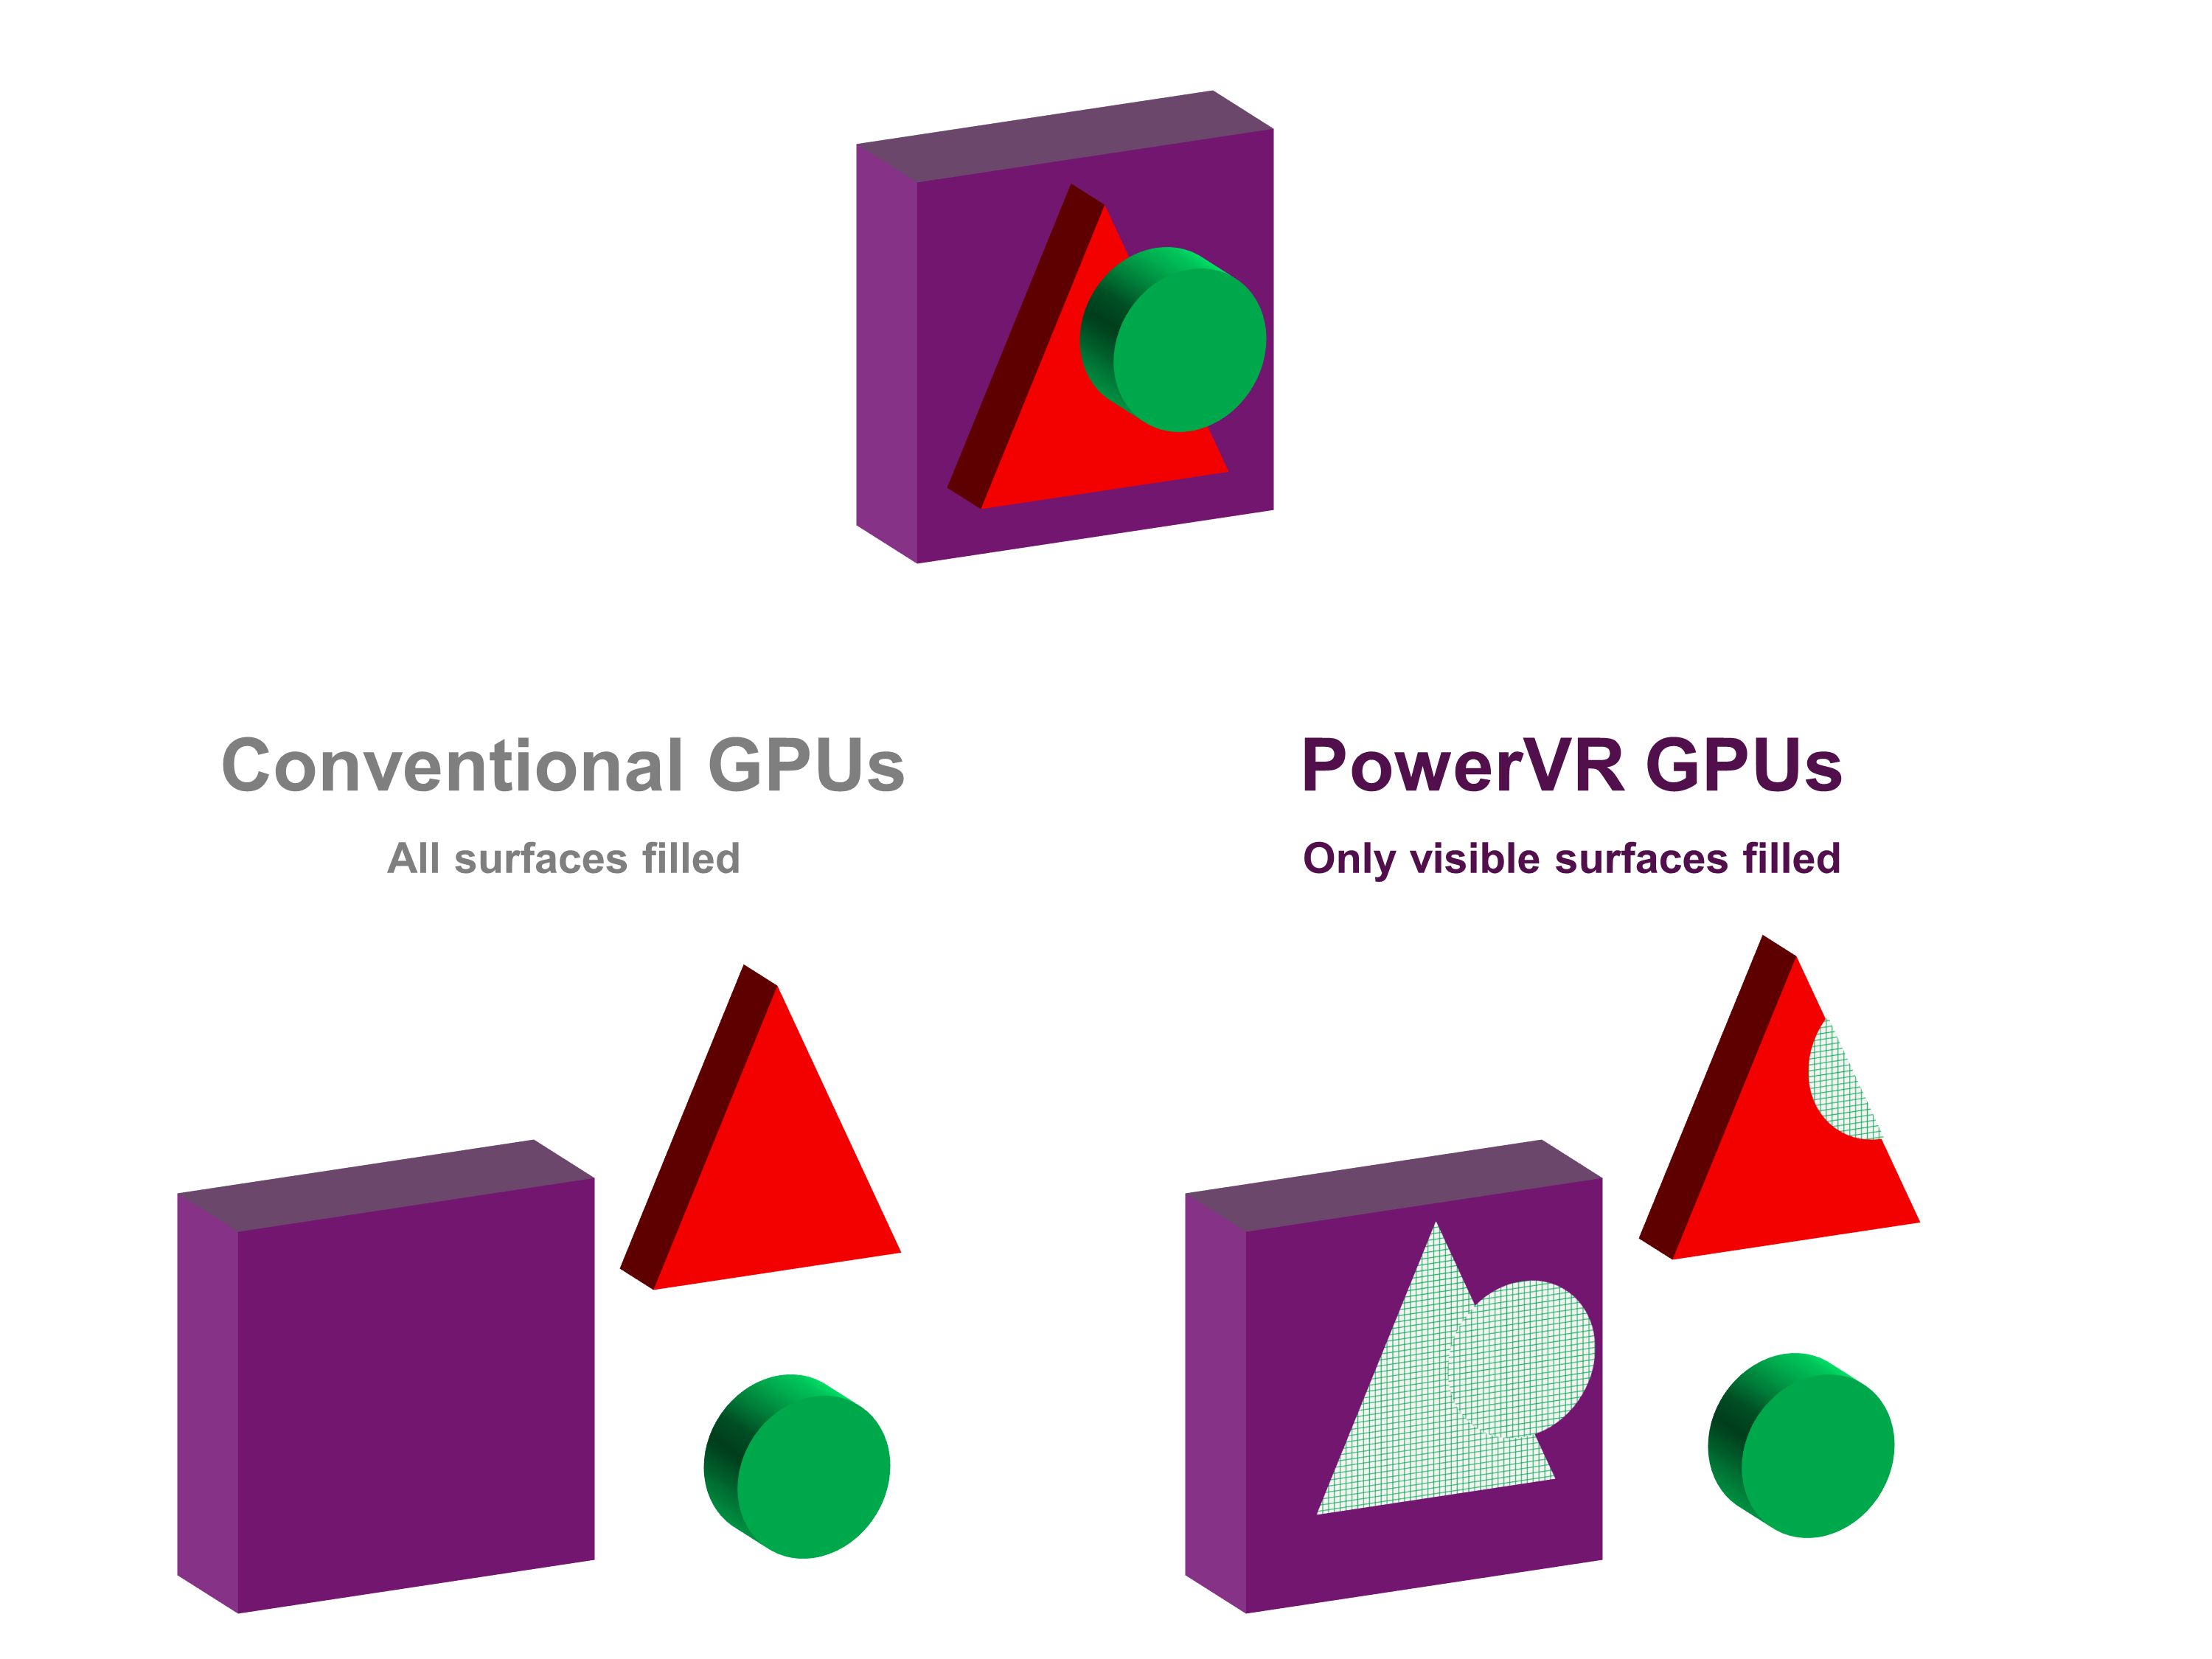
In a typical immediate mode renderer (IMR) architecture, the scene displayed above would have the red and purple colours calculated even in places where they would be obscured by the closer shapes. However, our architecture can determine opaque fragment visibility before shaders are executed, which enables the GPU to discard all fragment shading operations that do not contribute to the final image colour. Removing redundant fragment shader execution from the pipeline saves time and processing power. If you are interested in the details of TBDR, you can find more here.
Profiling graphics processors
A good start when profiling is to follow these three rules to ensure you get the best performance from your application.
- Analyse performance using an appropriate tool, then use the data provided to identify any bottlenecks
- Figure out where the bottleneck is in your application
- Modify your application to eliminate the bottleneck.
For example, if you have uncompressed textures and you want to reduce your memory bandwidth, you need to compress the textures to get better performance.
One of the most important factors that people sometimes forget is to complete the cycle and go back to the first step and run the analysis tools again to verify that the changes have improved performance. This is because you may have had a regression instead or you may have introduced a bug into the application which, in fact, has harmed the performance.
Here are some free tools you can use for the three above steps.
PowerVR Graphics toolset for performance profiling
Our PowerVR tools and SDK provide developers with profiling and debugging tools. These include;
- PVRTune (a graphics core performance analysis tool)
- PVRTrace (an OpenGL ES analysis tool)
- PVRMonitor (an Android application that allows you to view real-time hardware performance stats)
- PVRScope (a tool for integrating some of the functionality of PVRTune inside your own application)
- PVRShaderEditor (a tool for shader code optimization).
PVRTune
PVRTune is a real-time hardware performance analysis software. It runs on the device live and lets you see all of the data going straight from the GPU, such as timing data. It also allows you to rapidly view CPU and GPU performance to help you mitigate performance bottlenecks.
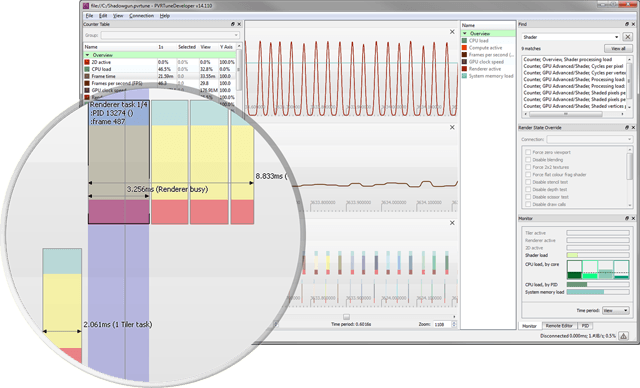
Combined with the PVRTrace recording libraries, PVRTune can capture OpenGL ES API usage data, such as API call timing and counters (e.g., number of submitted triangles per-frame and number of texture modifications per-frame). The PVRTrace libraries also enable users to make real-time modifications to the OpenGL ES render state, e.g., forcing all texture samples to use a 2×2 image stored in the graphics core cache.
Do go to our developer page to find out more about PVRTune.
PVRTrace
PVRTrace is an OpenGL ES call recording library and utility. The tool intercepts OpenGL ES calls and saves them to a file, which can be played back on other devices or desktop machines. This allows focusing on the graphics API calls made by the application rather than diving into an apps rendering engine code.
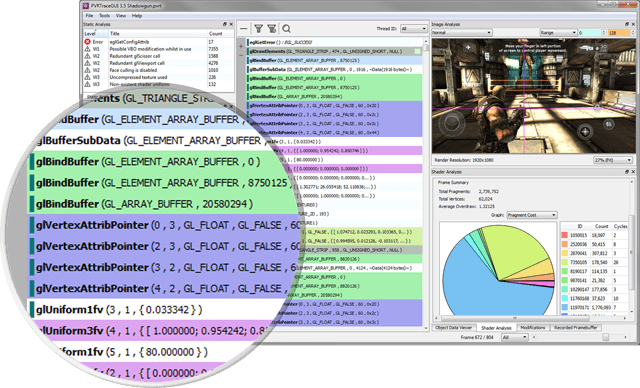
The recording can then be played back on other devices back onto a Linux system, Windows, etc. to try and identify where things are or are not working. PVRTrace comes also as a graphical user interface (GUI) that will actually analyse an API call stream and allows the easy inspection of the calls in a user-friendly manner. One powerful feature of the tool is called Static Analysis, which gives you at-a-glance feedback where mistakes have been made with the API, e.g., where uncompressed textures have been used.
PVRMonitor
This tool is an Android application that allows you to view real-time hardware performance stats. The stats show information about processor usage on the CPU and PowerVR graphics hardware, with negligible impact on performance.
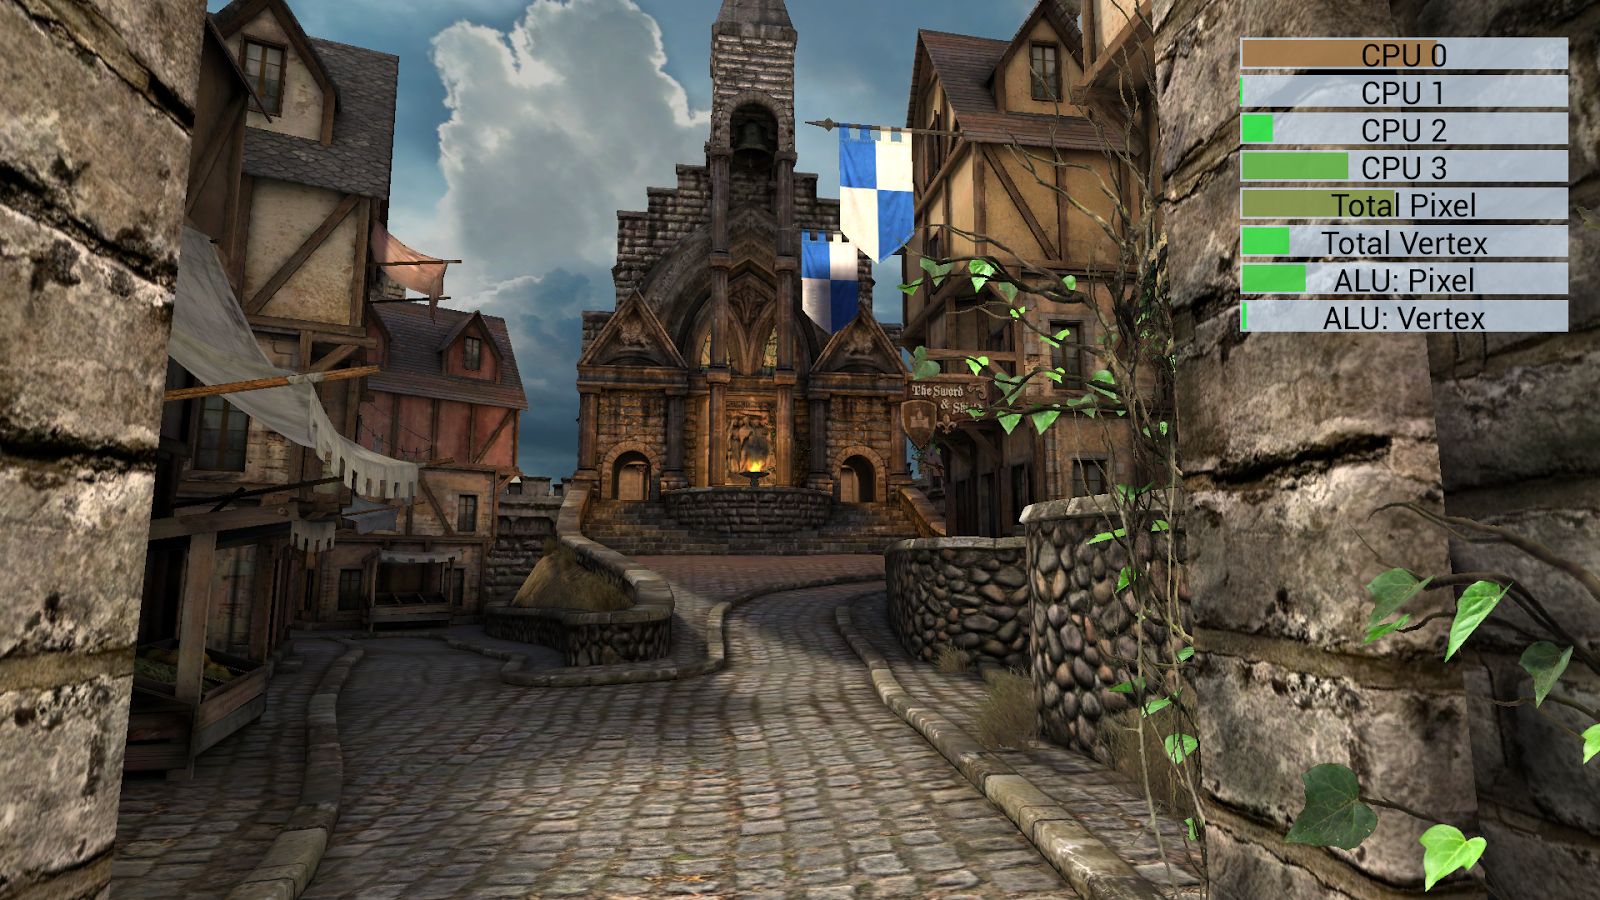
The data is presented as a bar graph that is updated in real-time and overlaid on top of your currently running applications.
Coming soon and further reading
In the next post, I will explain how the tools described above were used to analyse the performance of Fantasy Warrior 3D on our reference device.
Cocos 2D-based games such Fantasy Warrior 3D run great on our GPU architecture and our IP offerings have only gotten better – as a case in point check out our latest GPU IP – the IMG A-Series.
Please let us know if you have any feedback on the materials published on the blog and leave a comment on what you’d like to see next. Make sure you also follow us on Twitter for more news and announcements from Imagination.